


Channel-Level Accountability
You do not just see your overall P&L. You see which specific signal provider made it and which one cost it. Automatic Scale, Hold, Drop, and Too Early verdicts tell you exactly who to cut and who to scale up.
Journal brings your copied-trade history into a dedicated analytics view, with filters for workspace, account, and date range.
You do not just see your overall P&L. You see which specific signal provider made it and which one cost it. Automatic Scale, Hold, Drop, and Too Early verdicts tell you exactly who to cut and who to scale up.
Gross profit is vanity. Every metric in the Journal deducts swap, commission, and broker fees automatically. No manual math. No hidden costs eating into your results unnoticed.
The Channels tab shows exactly what your total P&L would look like without your worst-performing channel. That one number makes the decision obvious. Keep it, cut it, or wait for more data.
Already using trade2sync Copier? The Journal is already connected. No CSV imports, no broker re-linking, no API keys. Enable it with one click inside your existing dashboard and your data is ready instantly.
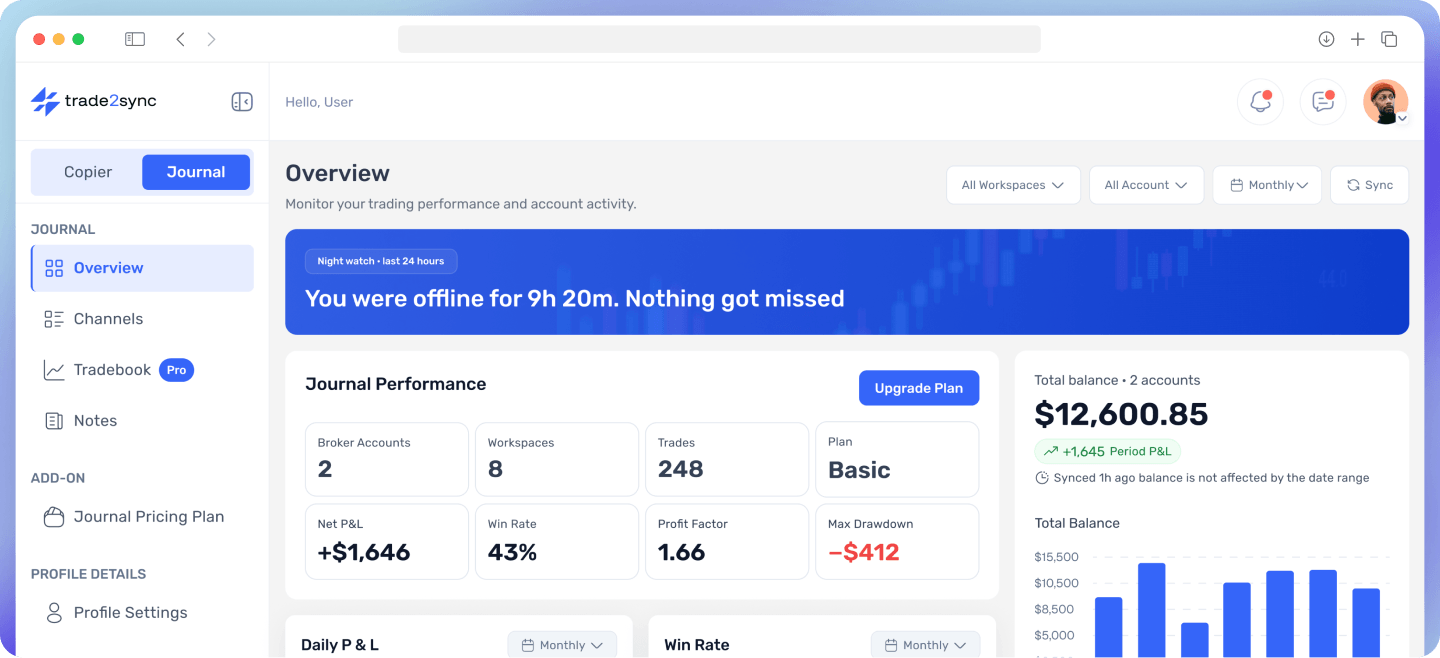
One filter at the top updates everything. Slice deeper by symbol, session, direction, calendar day, or channel. Net P&L, win rate, profit factor, drawdown, daily P&L. Add a private note to any day, channel, or individual trade wherever context matters.
Preview how Journal turns copied-trade history into channel comparisons, performance summaries, and detailed trade breakdowns.
Overview
Monitor your trading performance and account activity.
Every metric uses closed trades only and deducts all broker costs before showing you a result.
Your real profit or loss with every broker cost already deducted. See your total for the selected period and break it down day by day to spot patterns, find losing streaks early, and know exactly which days carried your month.
The percentage of closed trades that ended in profit. Breakeven trades are excluded so they never inflate your number.
How much you earn for every dollar you lose. Above 1.5 means the strategy is working well. The higher the number, the more efficient the channel.
The biggest fall from a peak in your selected period. Tells you how rough the ride was, even if you ended up profitable.
A monthly view where every trading day is coloured by its result. Green for profit, red for loss, neutral for no trades. Tap any day to see its total P&L and trade count.
Performance split across Asian, London, and New York sessions. Find out when your signals are most reliable and when they are not.
Every metric uses closed trades only and deducts all broker costs before showing you a result.
You do not just see your overall P&L. You see which specific signal provider made it and which one cost it. Automatic Scale, Hold, Drop, and Too Early verdicts tell you exactly who to cut and who to scale up.
See which channel is carrying your account and which one is dragging it down. The Channels tab highlights your best and worst performer so you know exactly where to add allocation and where to cut without digging through the numbers yourself.
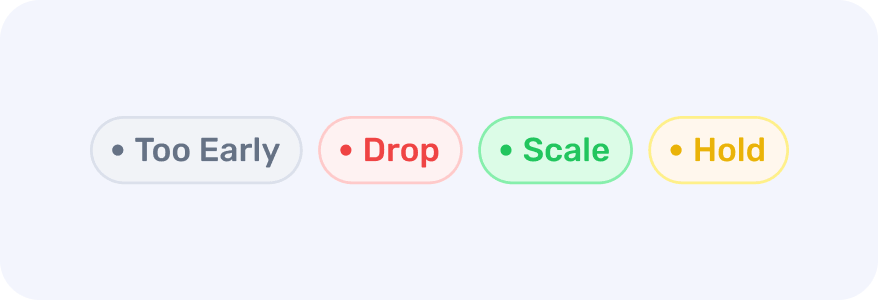
An automatic label on every channel based on its performance in the selected period. Too Early, Drop, Scale, or Hold. No manual analysis needed. Just look at the verdict and act.
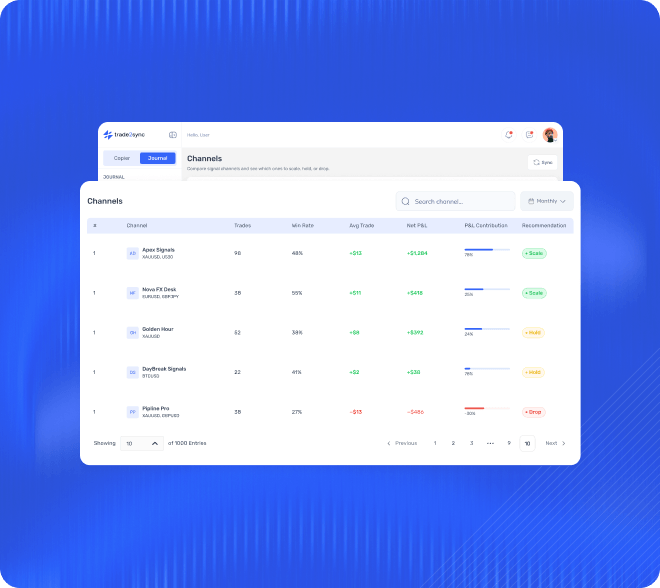
Knowing exactly which signal channels drive returns and which ones drag you down.
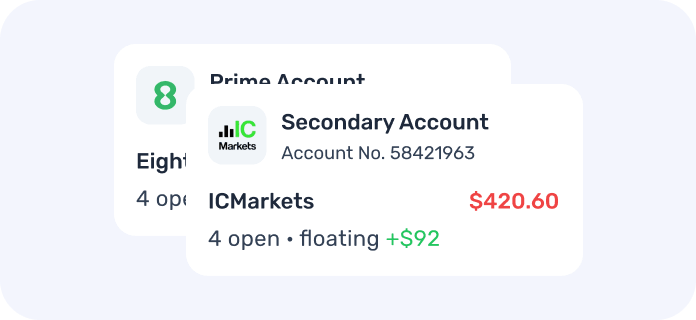
The Journal breaks it down by workspace, account, and channel so you know where every dollar came from.
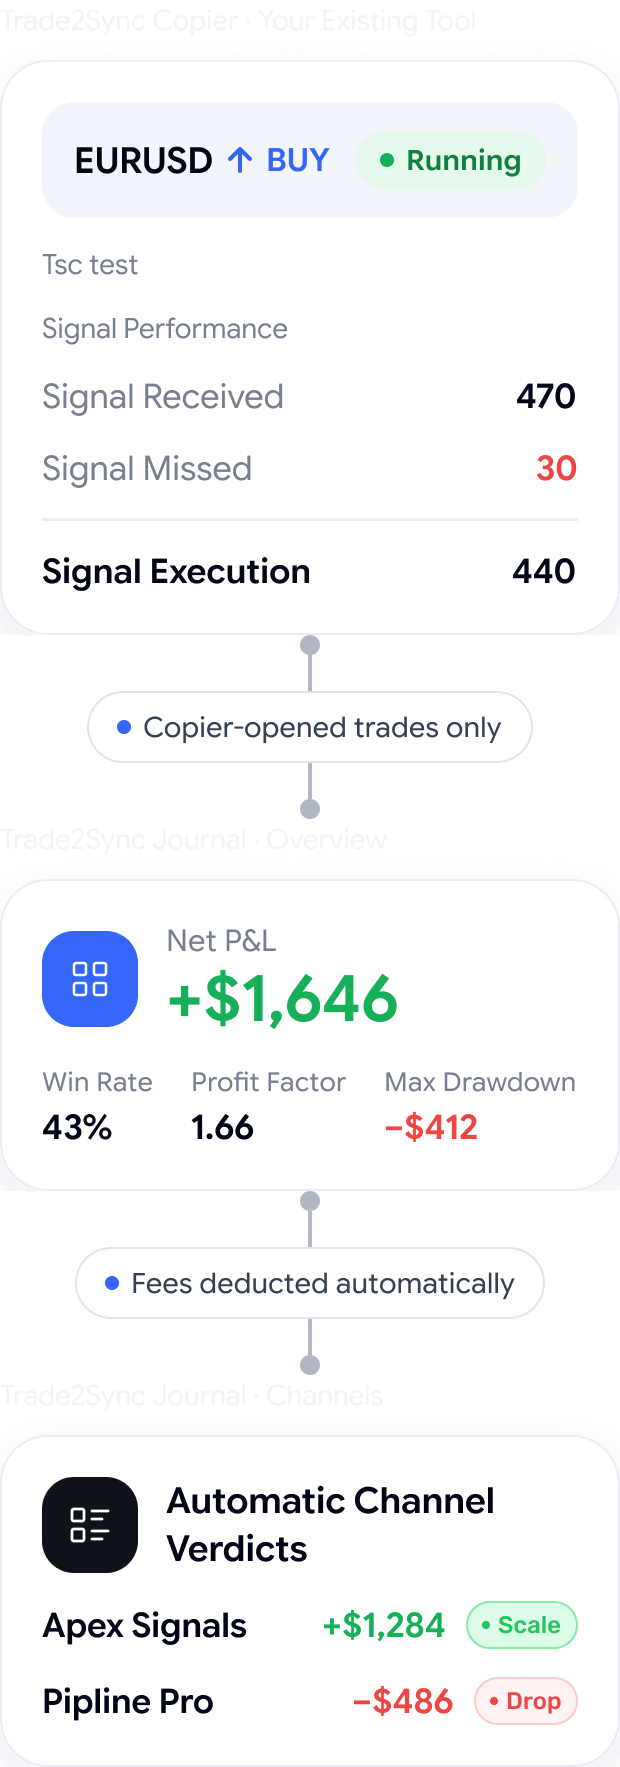
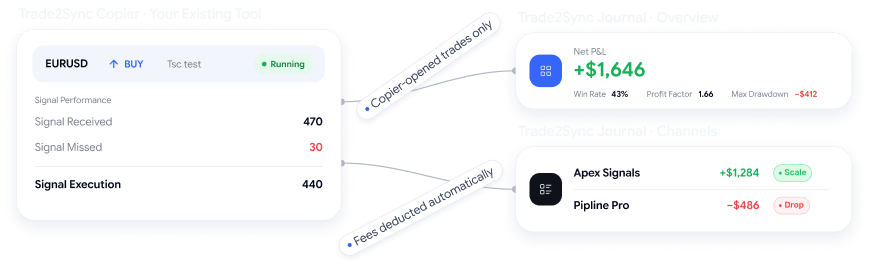
Every metric tracks only copier-opened trades. Manual trades never mix in.
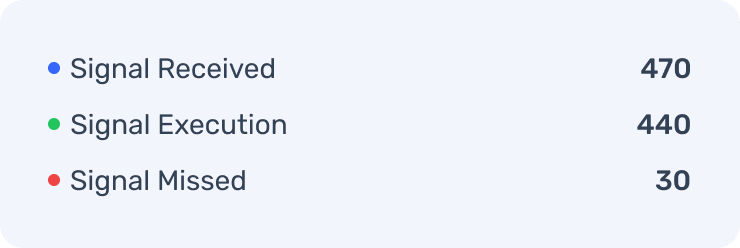
Attach a private note to any day, channel, or trade and always know the story behind the stat.
The Journal strips suffixes and groups them correctly.
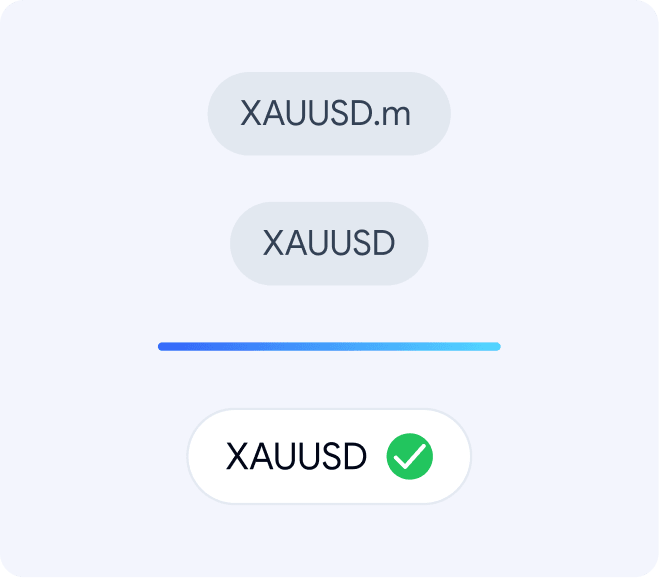
Every metric deducts swap, commission, and broker fees automatically. No surprises.

Automatic Scale, Hold, Drop, and Too Early verdicts tell you exactly who to cut and who to scale.
Quick answers to the questions we hear most. Still stuck? Our team answers every message within 10 minutes.
Can't find the answer you're looking for? Our friendly support team is here to help you anytime.
Stop guessing which signals work. Enable the Journal add-on in your trade2sync account today. Choose Journal for core channel verdicts, overview tracking, Tradebook symbol, session, and trade log analytics.


